


.png)
© 2025 Onward. All rights reserved.
Designed by BX Studio

Most teams should plan and optimize to contribution margin, then track ROAS as a context metric. Contribution margin shows profit after all variable costs; ROAS only shows revenue per ad dollar and can hide losses. The big caveat: you need clean cost data and a simple way to calculate CM daily.
TL;DR: Contribution margin (CM) = net revenue minus all variable costs like COGS, shipping, fees, and ad spend. It’s the clearest way to know if scaling ads grows profit, not just revenue. CM should be your North Star; ROAS is a secondary signal to compare channel efficiency.
Definition (liftable): Contribution margin is the money left after all variable costs tied to a sale, including ad spend; it’s what’s available to cover operating expenses and become net profit.
{{video}}
“A lot of established agencies will operate on ROAS. I think ROAS is dead… It’s based on revenue, not margin. Onward’s approach is based on profitability.” — Ryan Donovan, CMO 500 LEVEL
ROAS measures revenue per advertising dollar. It does not include product cost, shipping, payment fees, or returns. A 3.0 ROAS looks healthy until you layer in costs and discover you’re scaling losses. That’s why sophisticated operators evaluate profitability with CM instead of vanity efficiency alone.
A quick example many teams miss:
When you calculate CM at the product or order level, you can scale the SKUs and channels that produce profit, not just revenue. CM forces you to treat a product with 20% profit differently from one at 80%, a blanket ROAS target won’t cut it.
How CM fits your P&L:
“Single source of truth” dashboards help here. They pull ad platforms, CRM, and billing together so you can see cost and revenue in one place and make daily decisions on what to scale or pause.
Use CM to decide; use ROAS to compare.
What most teams miss: CM naturally penalizes returns, shipping, and fees. That’s the point, you want the metric to reflect reality, not channel vanity.
Why it’s worth it: Contribution margin transforms paid media from “spend to hit ROAS” into “invest to print profit,” aligning marketing with P&L outcomes.
1) Dirty or missing cost data. If your shipping, payment fees, and returns are estimates, CM will wobble. Start with 90-day averages, then refine with order-level data as you mature.
2) Over-segmented ad structures. Consolidate where you can; better conversion data allocation improves modeling and stability of your CM math.
3) Discounting blind spots. Promo depth quietly raises break-even ROAS and can kill CM. Model the curve before you launch the sale.
4) Misusing ROAS. Treat ROAS as a comparator, not a goal. A lower-ROAS campaign can beat a higher-ROAS one on contribution dollars.
Where this can fail: If you don’t centralize platform, billing, and cost data into one “profit” view you trust daily, you’ll revert to ROAS because it’s easy, not because it’s right.
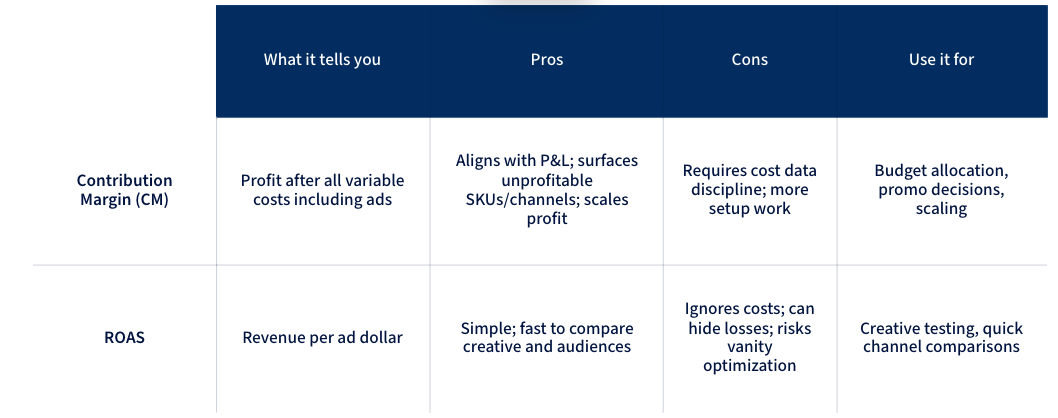
Key takeaway: Let CM decide; let ROAS compare.
How do I calculate contribution margin quickly?
Use CM3: Revenue − (COGS + shipping + fulfillment + payment fees + returns + marketing). Start with 90-day averages if you lack order-level data, then refine.
How long before I can trust CM?
Most teams get a stable read in 30–60 days if they centralize data and enforce a single formula. Clients often recognize it’s “working” in the first 1–2 months.
Is ROAS useless then?
No. Keep ROAS for apples-to-apples creative and channel comparisons. But make funding and scaling decisions on CM.
What’s a good contribution margin target?
Category matters, but many brands target ≥35% CM when scaling paid. Calibrate by vertical: Apparel often runs 50–70%, Food & Bev 20–40%.
How do discounts affect my targets?
Deeper discounts push up break-even ROAS. At 20–40% promo depth, you may need roughly 2x the ROAS just to break even—CM will reveal that early.
Contribution margin should lead your planning and optimization; ROAS should support as a comparison metric. The risk is ignoring costs, especially discounts, shipping, and returns. Start with a clean CM3 formula and one “profit” dashboard.
Next steps you can run this week:
Stress-test your discount strategy vs. break-even ROAS before you launch.


.svg)
