


© 2025 Onward. All rights reserved.
Designed by BX Studio


To calculate contribution margin, subtract all variable costs from net revenue: contribution margin = net revenue − variable costs. Divide the result by net revenue to get your contribution margin ratio. Variable costs are the costs that rise with every order, such as product cost, shipping, packaging, payment fees, and returns. The result tells you how much each sale leaves to cover fixed costs, pay for customer acquisition, and produce profit.
Key takeaways
The formula has two versions, and most teams use both:
The dollar figure shows how much cash a sale generates. The ratio lets you compare products at different price points.
Getting the inputs right matters more than the arithmetic. Most errors come from costs that land in the wrong bucket or never get counted, which is why a marketing data warehouse that joins order, cost, and ad data is often where accurate margin reporting starts.
A cost is variable if it goes up when you sell one more unit and down when you sell one fewer. Common variable costs for an ecommerce or subscription business include:
Fixed costs stay roughly the same regardless of volume: salaries, rent, software subscriptions, and agency retainers. They matter for overall profit, but mixing them into contribution margin makes every product look worse than it is.
A hypothetical example: a skincare brand sells a kit listed at $100. Here is one average order.
Some analysts label these layers CM1 (after product cost), CM2 (after fulfillment, fees, and returns), and CM3 (after marketing). The labels matter less than using one definition everywhere, from finance reports to ad dashboards.
Contribution margin per order is the ceiling on what you can pay to acquire a customer on the first purchase. In the example above, any customer acquisition cost below $34.40 makes the first order profitable before fixed costs. Spending more than that means the first order loses money.
Brands with strong repeat purchase rates can choose to spend above that ceiling, because later orders add more contribution. Continuing the hypothetical example: if the average customer places 2.5 orders over their lifetime, lifetime contribution is about $86. Accepting a first-order loss only works if the brand knows how long payback takes and has the cash to wait. The Onward post on improving efficiency with CAC payback and LTV covers how to manage that tradeoff week to week.
Blueprint is a useful reference point. The health subscription company cut customer acquisition cost 57% while scaling monthly ad spend 11x with Onward, as described in the 57% CAC reduction case study.

A blended contribution margin averages strong products with weak ones, so the total can look healthy while one product line loses money on every order.
A product with heavy returns may need a lower CAC target than one customers keep. Apparel is a common case: return rates vary widely by style and size, which is why Onward's apparel marketing agency team reports contribution margin after returns, discounts, and marketplace fees rather than on gross sales.
The same logic applies to advertising. Return on ad spend counts revenue, not what it is worth after costs, so the comparison of contribution margin vs. ROAS is worth reading before you set channel targets.
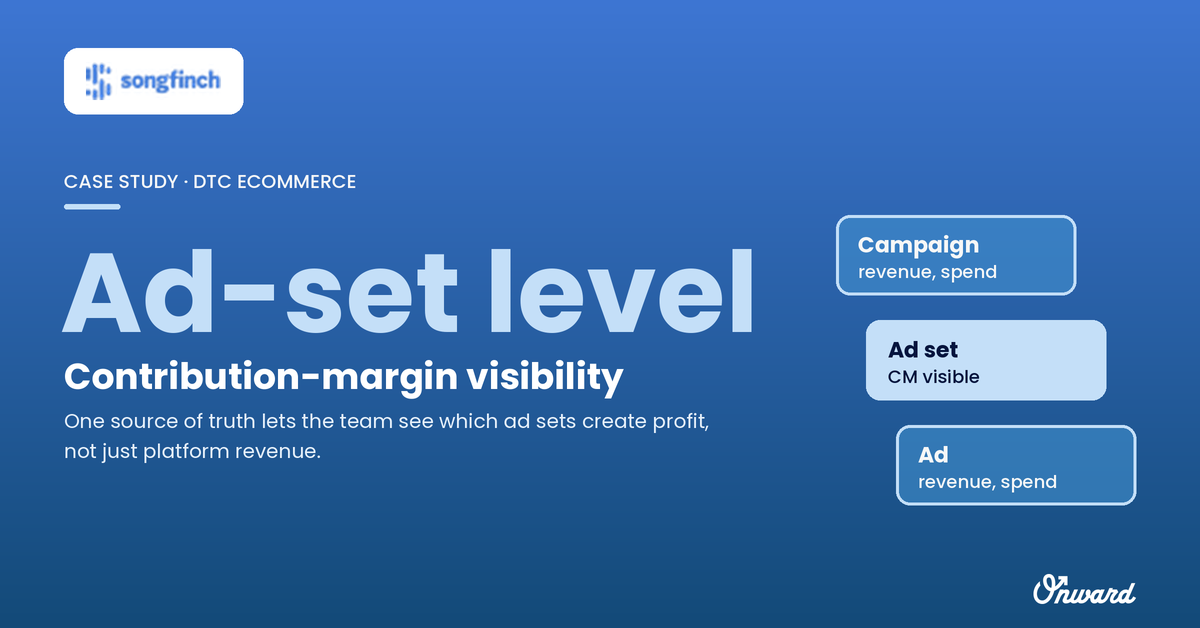
Songfinch, the personalized song company, reads margin at the ad-set level because its marketing data reconciles with Stripe at better than 99%.
At 500 LEVEL, the sports apparel retailer, margin is visible for each creative asset in one live view built from 9+ data sources.

Gross margin subtracts only cost of goods sold from revenue. Contribution margin goes further and subtracts every variable cost, including fulfillment, payment fees, and returns, so it is the better guide for deciding what each sale is worth.
Calculate it both ways. Contribution margin before marketing tells you how much you can afford to spend on acquisition. Contribution after marketing tells you whether a campaign, product, or channel actually made money.
It depends on your category, your fixed cost base, and how often customers buy again. The useful test is whether contribution after marketing covers fixed costs and leaves profit at the volume you plan to reach.
Contribution margin is net revenue minus every cost that grows with each order. Calculate it per order, convert it to a ratio, and use it to set CAC targets by product and channel. The hard part is not the math but getting reliable cost, order, and ad data into one place. To see your own contribution margin by product and campaign, schedule a free audit.