

.png)


© 2025 Onward. All rights reserved.
Designed by BX Studio


To track where your small business customers come from, record a source on every customer record, not just every website visit. Combine three inputs: what customers tell you, what your website analytics capture through tagged links, and what your phone and sales systems log. Then reconcile them against actual sales once a month. No single tool sees everything, but together they show which channels produce paying customers.
Customer source tracking is hard because each tool only sees part of the journey. Google Ads counts conversions it influenced. Meta counts people who saw or clicked an ad. Your analytics tool sees website sessions but not phone calls, walk-ins, or the friend who recommended you. Each one reports in good faith, and each one claims credit for some of the same customers.
Small businesses feel this more than large ones because so much of the journey happens offline. A customer might see an Instagram ad, search your name a week later, call from the Google listing, and book over the phone. Without a deliberate setup, that sale shows up nowhere, or in three places at once. Building unified marketing data is how larger teams solve this, and the same principles scale down to a five-person business.

Use the following methods together. Start with the first two, which cost nothing, and add the rest as volume grows.
Self-reported source is the simplest way to capture word of mouth, events, and offline ads. Make it reliable:
People misremember, often naming the last thing they saw. That is why self-reported data works best alongside digital tracking rather than instead of it.
UTM parameters are short tags added to a URL, such as utm_source=instagram&utm_medium=paid_social&utm_campaign=spring_promo. Analytics tools read them to label where a visit came from. Tag links in ads, emails, social bios, QR codes, and partner websites, and keep a shared spreadsheet of naming rules so "Facebook," "facebook," and "fb" do not become three separate sources.
In Google Analytics 4, define the actions that matter, such as a form submission, booking, purchase, or click-to-call, as key events. The traffic acquisition report then shows which sources lead to those actions, not just visits. Confirm each event fires by completing it yourself before trusting the numbers.
Many service businesses get most of their customers by phone. Call tracking numbers assign a different number to each channel, such as your website, Google Business Profile, and print ads, so calls can be attributed. For in-store or event sales, unique promo codes per channel do the same job.
The step most small businesses skip is linking the lead source to the eventual sale. A form fill tagged "Google Ads" means little until you know whether that person paid, how much, and whether they came back. A CRM, or even a well-kept spreadsheet, should carry the source from first contact through to invoice. The practice of sending CRM stages back to Google Ads also helps campaigns learn which leads become customers.
Build one monthly table with a row per channel and four columns: new customers, revenue from those customers, marketing spend, and cost per new customer. Pull customers and revenue from your sales system, not from the ad platforms, and use self-reported answers to fill in channels that analytics cannot see.
A spreadsheet works at first. As channels multiply, manual exports become slow and error-prone, and teams move to an automated setup that pulls each source into one place. The approach behind turning fragmented marketing metrics into decisions is the same at any size: one definition of a customer, one definition of revenue, and every channel measured against both.
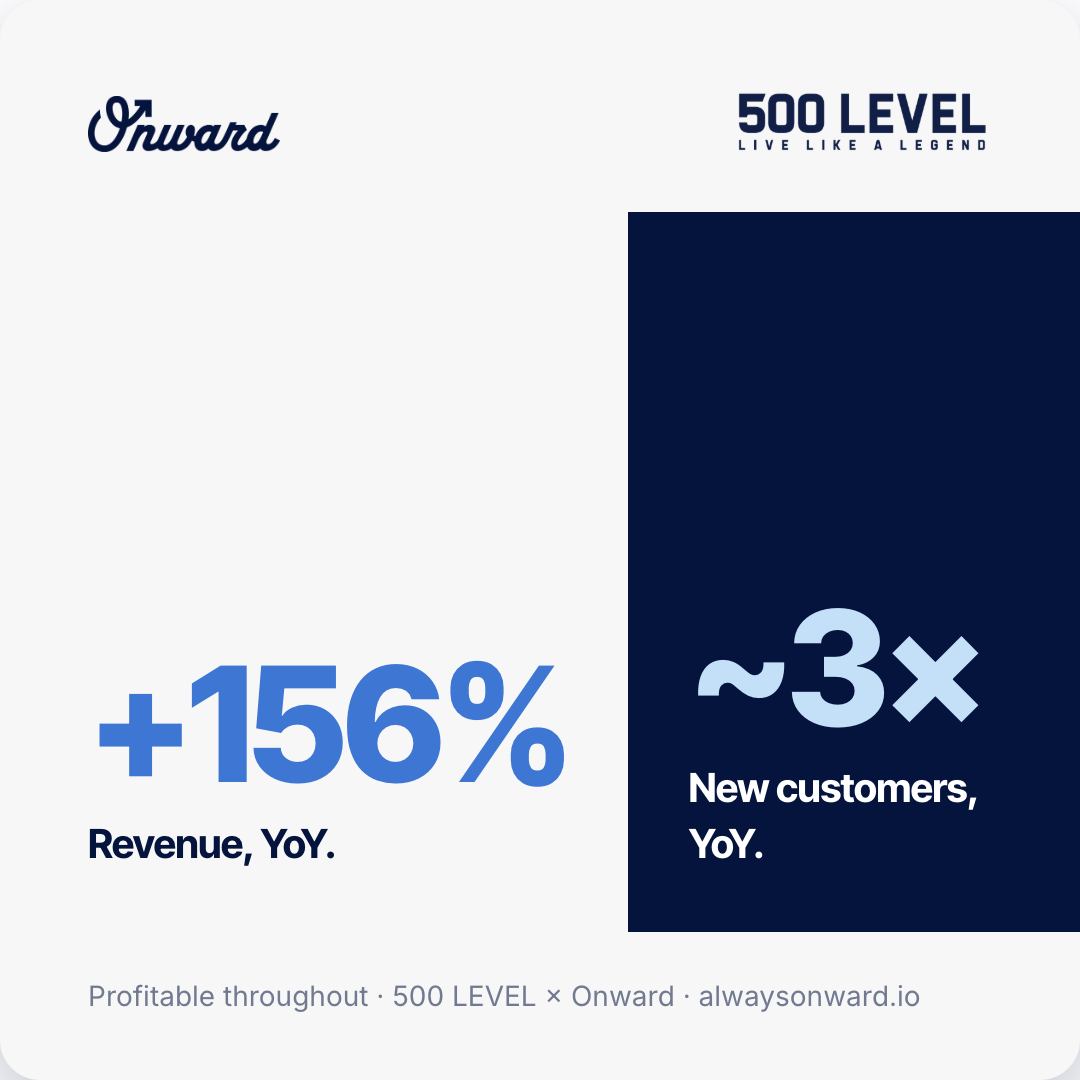
The payoff is trust in your own numbers. Songfinch now reconciles 99%+ of its marketing data with Stripe and can see contribution margin for each individual ad set, a result covered in the Songfinch single source of truth case study.

Expect disagreement and treat your sales system as the tiebreaker. If Google Ads reports 40 conversions, Meta reports 30, and you gained 50 new customers, the platforms are overlapping. Compare each channel's claimed results with the self-reported answers and with what happens when you pause or increase spend. A channel whose results hold up across all three views deserves more budget.
Review the table monthly, and present it as a simple chart of new customers and cost by channel. Marketing dashboards that drive decisions keep this review short and focused on what to change next.
Most tracking problems come from small habits rather than missing tools. Watch for these:
No. Google Analytics sees website visits and the actions taken on your site, but not phone calls, walk-ins, referrals, or whether a lead became a paying customer. Pair it with self-reported source and your sales records.
Ask. A required "how did you hear about us?" question with a "friend or family" option, plus a referral code or referral field, is the most reliable way to measure word of mouth.
Not on day one. A spreadsheet with consistent source labels works for low volume. Once you handle dozens of new leads a month, a CRM saves time and prevents lost records.
Track sources at the customer level, not just the click level. Ask every customer, tag every link, log every call, and tie each source to real revenue. Then compare channels monthly using your own sales data as the referee. For help setting up tracking you can rely on, talk to Onward's team.


.svg)
