



© 2025 Onward. All rights reserved.
Designed by BX Studio


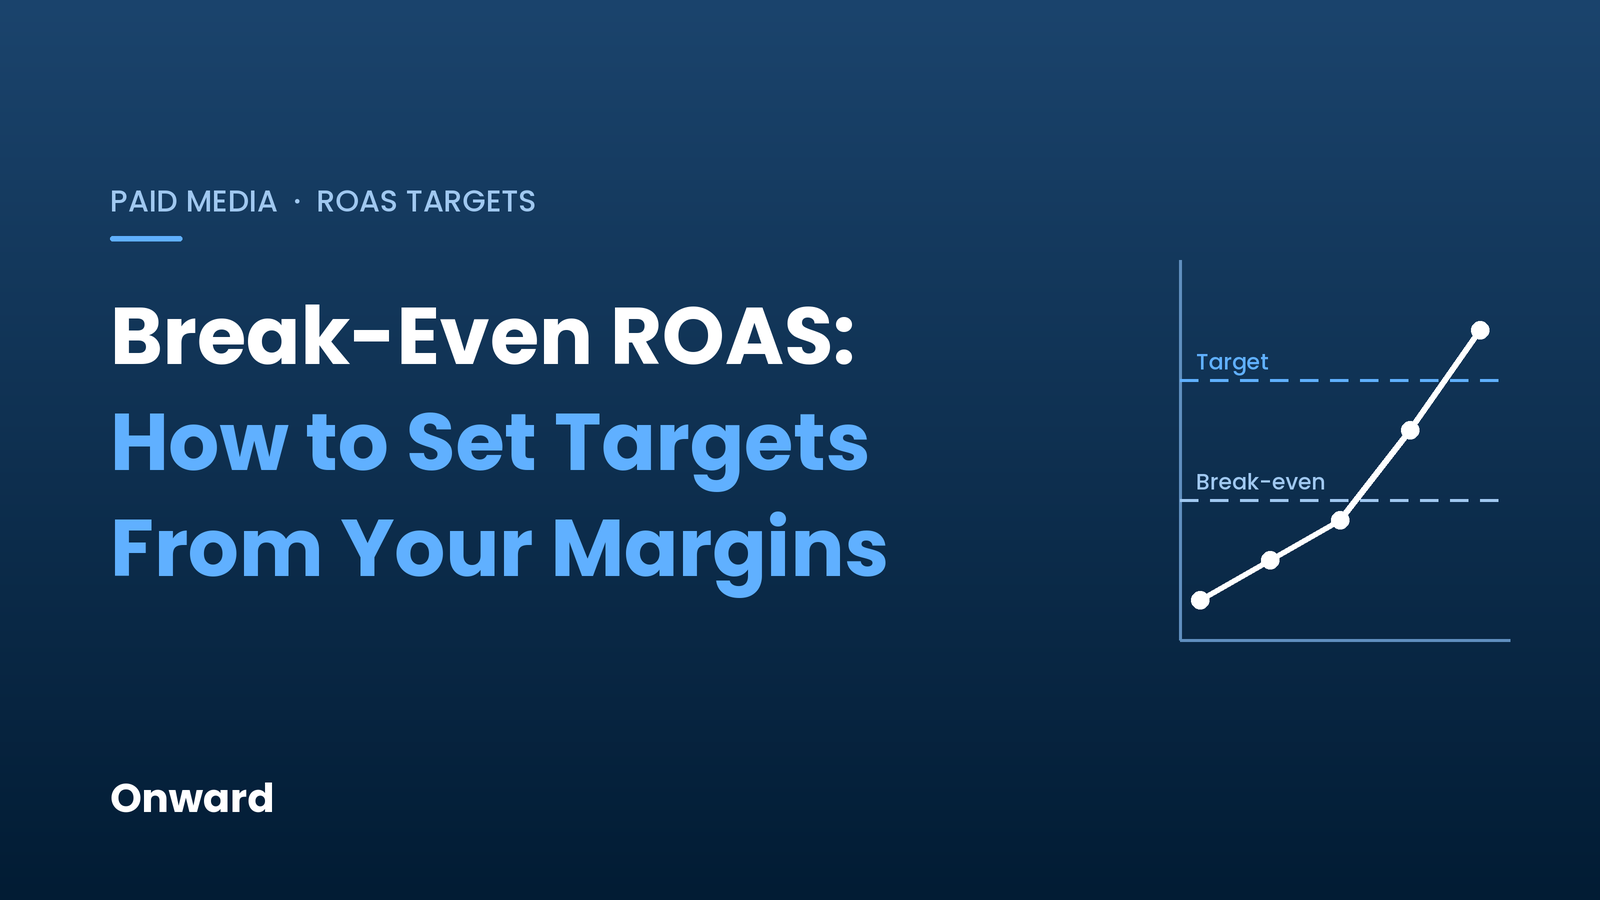
Break-even ROAS is the return on ad spend at which a sale covers its own product, fulfillment, and fee costs plus the ad dollars that drove it, leaving zero profit. You calculate it as 1 divided by your contribution margin percentage before ad spend. If 40% of each sale is left after variable costs, break-even ROAS is 2.5. Any ROAS target you set should start from that number, not from an industry benchmark or last quarter's average.
Break-even ROAS is the minimum revenue each ad dollar must generate for a campaign to pay for itself. Below it, every additional sale loses money once COGS, shipping, payment fees, and returns are counted. Above it, ad spend is adding profit.
Most teams set ROAS targets the other way around. They pick a round number like 3x or 4x, or they copy what the account did last year. Those targets can be far too strict for a high-margin product and dangerously loose for a low-margin one. Teams that run paid media management tied to contribution margin work backward from the economics of what they sell.
Start with one order and list every variable cost that order creates. For an ecommerce brand, that usually includes:
Subtract those costs from net revenue to get contribution margin before ad spend, then divide 1 by that margin as a percentage. The step-by-step contribution margin calculation covers which costs belong in the formula and which are fixed.
Hypothetical example: An order brings in $100 of net revenue. COGS is $35, shipping and fulfillment are $9, payment fees are $3, and returns average $5 per order. That leaves $48, or 48%, before ads. Break-even ROAS is 1 ÷ 0.48, or about 2.08. A campaign returning $2.08 per ad dollar on backend revenue makes no money and loses none.

A profit target is break-even ROAS adjusted for the margin you want left after ad spend. The formula is 1 ÷ (contribution margin before ads − target margin after ads).
Using the same example, if the business wants 15% of revenue left after ads, the target is 1 ÷ (0.48 − 0.15), or about 3.03. That 3.03 is the number a media buyer should optimize toward, and it comes straight from the product's economics. The gap between 2.08 and 3.03 also gives the team a clear operating range: below 2.08, cut or fix; between the two, the campaign is profitable but under target; above 3.03, there may be room to scale.
This is also where ROAS stops being enough on its own. Two campaigns can hit the same ROAS and produce very different profit if they sell different products, which is why optimizing paid media to contribution margin is the more complete approach once the data allows it.
A single account-wide target assumes every sale has the same margin. That is rarely true. The three most common reasons to split targets are:
A brand selling a 70% gross margin hero product and a 30% margin accessory line has two very different break-even points. If Shopping or Performance Max campaigns lean toward the low-margin line, a blended target will quietly let them lose money. Group products by margin band and set a target for each.
Return rates can swing contribution margin more than any other single cost, especially in apparel. A category with high returns needs a higher target than its gross margin suggests. This is why Onward reports contribution margin after returns for apparel brands at the style and variant level, not just the account level.
First-order break-even treats every customer as a single purchase. If new customers reliably buy again, the business can accept a first-order ROAS below break-even and still profit over time. That decision should rest on actual repeat-purchase data and a defined payback window, which is where improving efficiency with CAC payback and LTV becomes the next step.

500 LEVEL, a DTC licensed sports apparel brand, is an example of acquisition scaled on profit rather than platform ROAS: new customers grew from about 6,900 to 19,000 year over year, alongside 156% revenue growth. The full story is in nearly 3x new customers for a DTC apparel brand.
Set the target on backend revenue, then translate it for each platform. Meta, Google, and Amazon each attribute sales with their own rules, and the totals often exceed what your store or Seller Central actually recorded.
The translation is simple. If Meta reports $1.25 for every $1.00 that shows up in your backend, a backend target of 3.0 becomes a Meta target of about 3.75. Recheck that ratio regularly, because attribution settings, tracking changes, and creative mix can all shift it.
Onward builds targets from the client's own margin data. Product costs, fulfillment, fees, and returns are pulled into a single model through engineered analytics, so break-even and profit targets can be calculated by product group, channel, and customer type, then updated as costs change. The media team buys against those targets instead of a single blended number.

Break-even ROAS is the floor, and your margin structure sets it. Calculate it from real variable costs, add the profit you want on top, split it where margins differ, and anchor it to backend revenue. A ROAS target built that way tells your team exactly when spend is making money and when it is not.
If you want help turning your margins into channel-ready targets, talk to Onward's team.