


© 2025 Onward. All rights reserved.
Designed by BX Studio


Incrementality testing shows how many sales your ads actually caused, by comparing a group that saw the ads with a similar group that did not. For mid-size brands, the two most practical methods are geo holdouts, where you turn a channel off in selected regions and compare results with matched regions, and conversion lift studies run by the ad platforms. Neither needs an enterprise budget. They need a clear question, enough conversion volume, and backend sales data you trust.
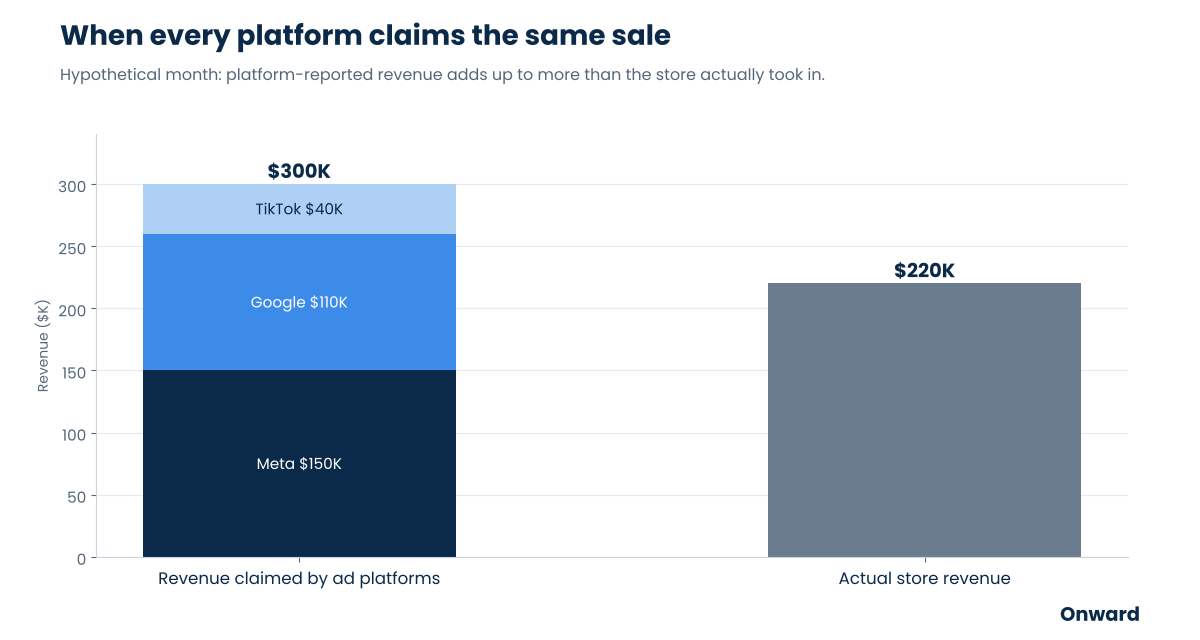
Every ad platform reports the conversions it believes it influenced, and each one credits itself. Add up the revenue claimed by Meta, Google, and TikTok and it often exceeds what your store recorded. Retargeting and branded search can look especially strong because they reach people who were already likely to buy. Teams running margin-focused paid media use incrementality tests to find out which spend is creating sales and which is collecting credit.
Mid-size brands feel this most. Budgets are big enough that misallocation is expensive, but rarely big enough for a full marketing mix model with years of clean data. A few well-designed tests a year close that gap.
Think of measurement as a ladder. Engagement metrics show ads are being seen. Platform conversions show which campaigns get credit. Backend data shows whether the business actually grew. Incrementality sits at the top, because it is the only level that shows what would have happened without the ads.

A geo holdout splits your market into regions, such as states, DMAs, or postal areas. In the test regions, a channel or campaign is paused or changed. In the control regions, it keeps running. Because the regions were chosen to behave alike before the test, the difference in sales during the test is a reasonable estimate of what the channel contributes.
Hypothetical example: A brand pauses Meta prospecting in regions that normally produce about 15% of sales. Over four weeks, those regions come in $36,000 below what the matched control regions predicted. The paused spend would have been $24,000, so incremental ROAS is 1.5. Meta's in-platform ROAS for the same regions was 3.0. The channel is working, but it creates about half the revenue the platform credits it with, and budget decisions should reflect that.
Conversion lift studies are run inside the ad platforms. The platform randomly withholds ads from a control group and compares conversions with the group that saw them.
As of November 2026, Google offers two types. Users-based Conversion Lift splits groups by aggregated user attributes and reports results by conversion action, age, and gender. Geography-based Conversion Lift splits by region, supports offline data, and covers Search, Shopping, Performance Max, Demand Gen, Video, Display, and App campaigns. Google's lift types comparison page notes that geo studies tend to need higher budgets, and access generally goes through a Google account representative. Meta offers conversion lift studies as well, typically set up with a Meta representative.
Platform lift studies are convenient and statistically rigorous within one platform. Their limits are that they measure one channel at a time, they depend on the platform's own conversion tracking, and they may not be available below certain spend levels.
The most useful output of a test is a calibration factor. If Meta's true incremental return is about half its reported ROAS, you can adjust targets and keep using platform data for daily optimization. That only works when ad spend, orders, and costs live in one place, which is the role of unified marketing data. It is also central to how Onward turns fragmented metrics into decisions.
There is no single threshold. What matters is whether the holdout covers enough conversions to detect a realistic lift. A power analysis before the test tells you whether your volume is sufficient. Platform lift studies may also have their own minimums.
Long enough to cover at least one full purchase cycle and collect sufficient conversions, which is often several weeks. Brands with longer consideration periods need longer tests.
Some sales may be lost in the holdout regions while the test runs. Keeping the holdout share modest limits the cost, and the insight usually pays for it many times over in better budget allocation.
Incrementality testing is how a mid-size brand learns what its ads really cause. Geo holdouts give a cross-channel view grounded in your own sales data, and conversion lift studies add precision inside each platform. Run a few a year, measure in margin, and use the results to calibrate everything else.
If you want help designing your first incrementality test, talk to Onward's team.