

© 2025 Onward. All rights reserved.
Designed by BX Studio


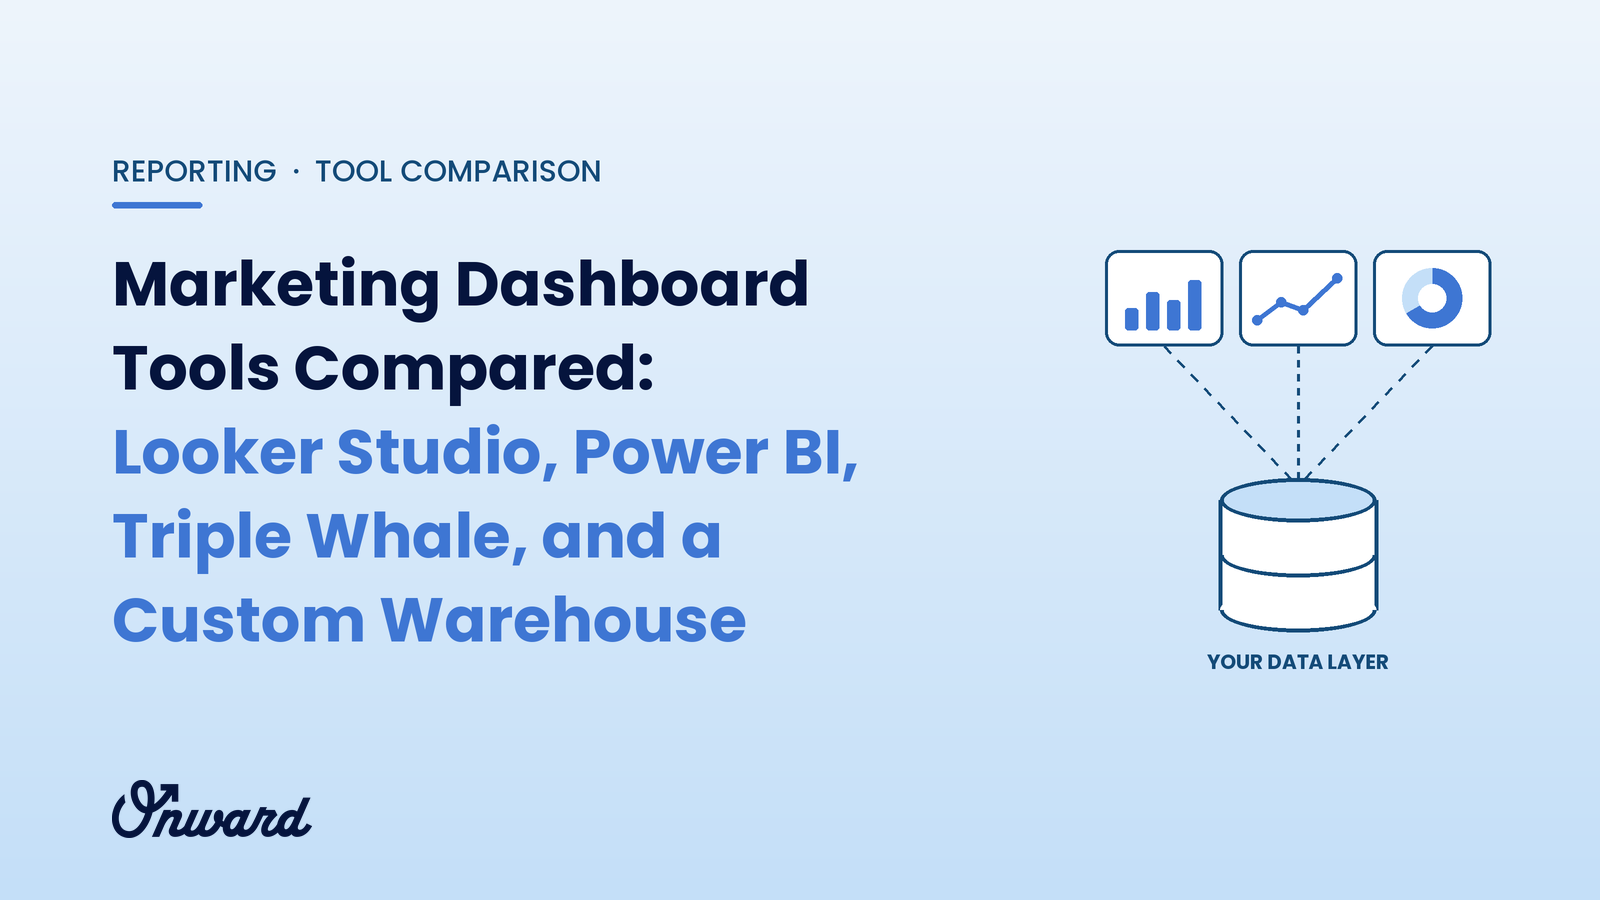
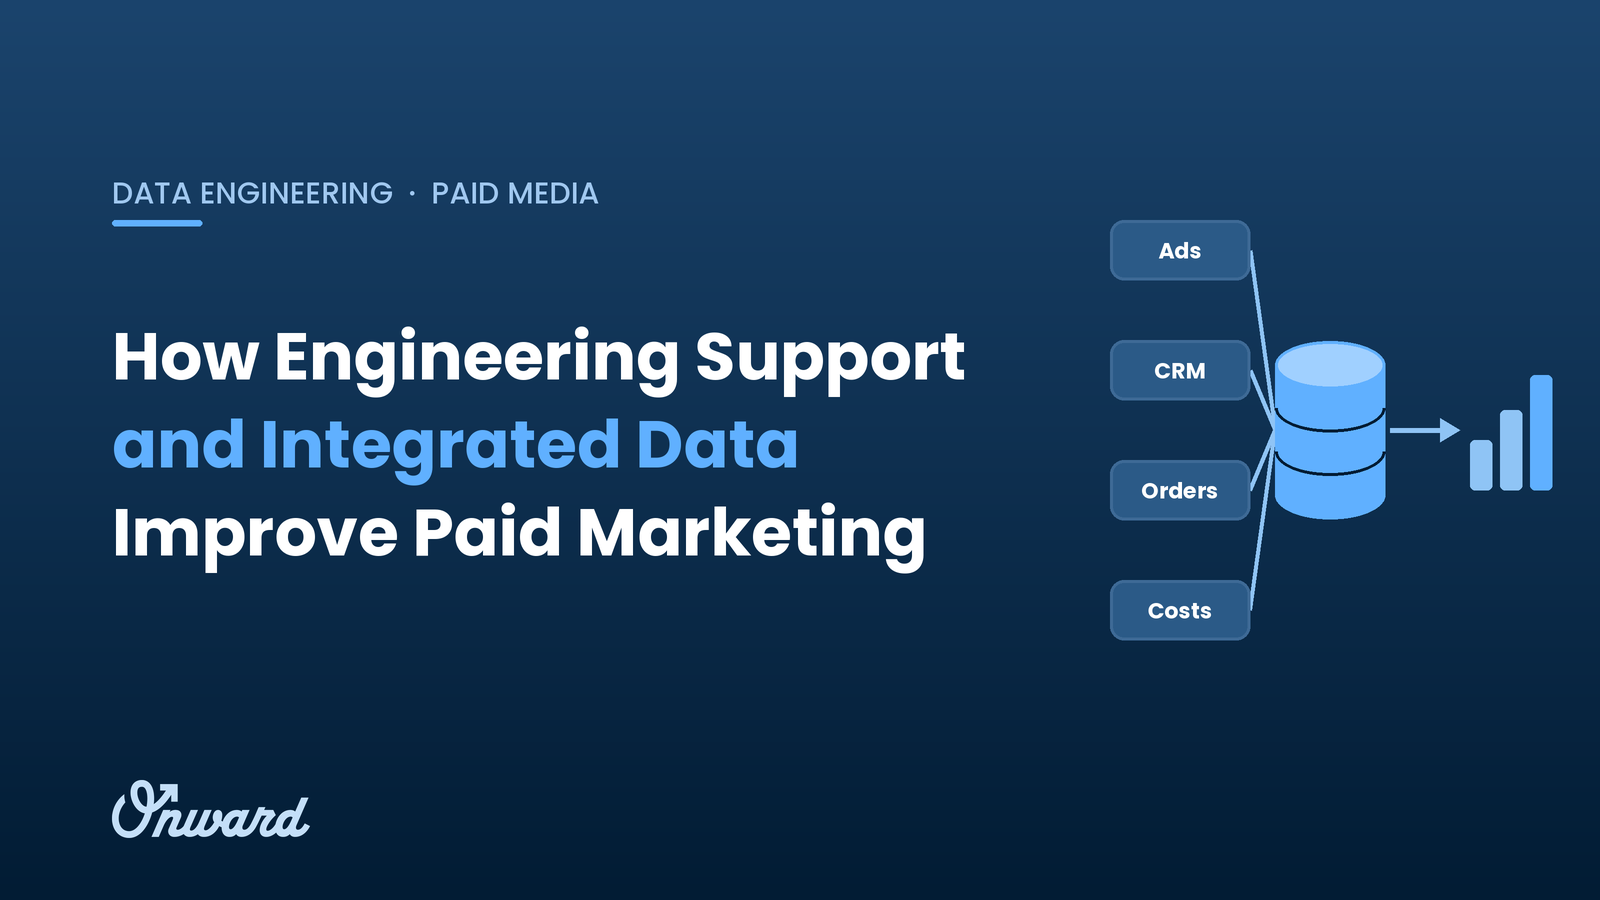
Looker Studio, Power BI, Triple Whale, and a custom warehouse solve different problems. Looker Studio is the cheapest way to chart Google data. Power BI fits teams that already work in Microsoft and need deeper modeling. Triple Whale gives Shopify brands attribution and ecommerce metrics out of the box. A custom warehouse is not a dashboard at all: it is the data layer that joins ad spend, orders, CRM, and costs under business logic you own, and any of the first two tools can sit on top of it.
The four options differ in where metric logic lives. In Looker Studio and Power BI, logic lives in each report or data model your team builds. In Triple Whale, most of it lives in the vendor's product. In a warehouse, it lives in tables and code your company owns, which is the core of marketing data infrastructure.
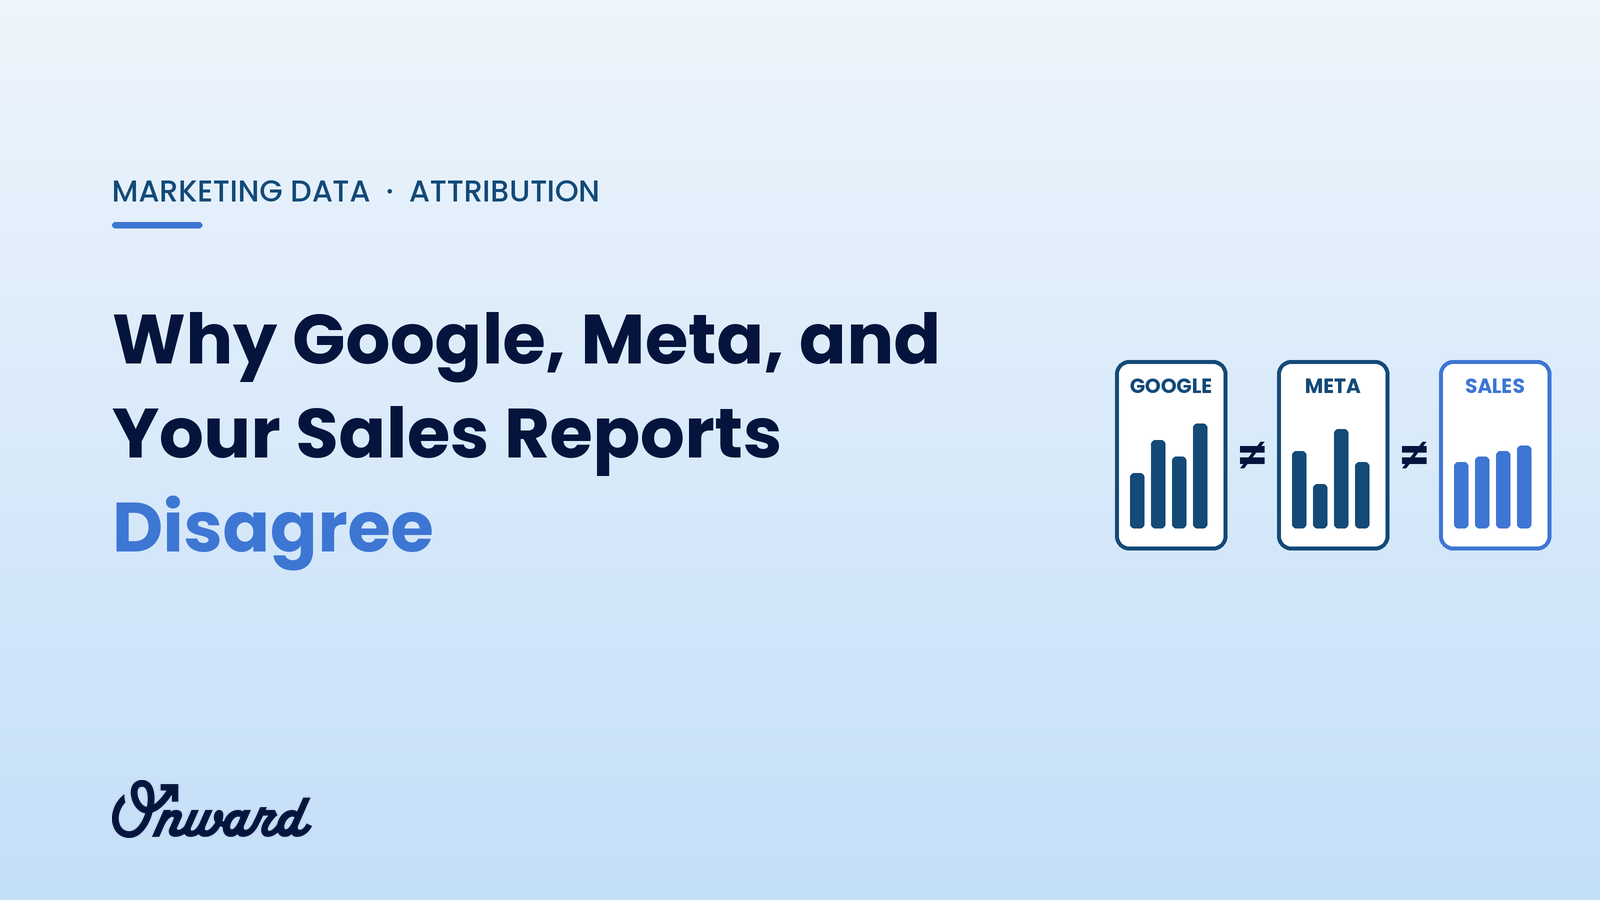
That distinction decides what happens when two numbers disagree. If CAC in a Meta report differs from CAC in the finance deck, someone has to know where each was calculated and fix one definition for everyone.
Looker Studio is Google's free reporting tool. As of October 2026, Google's product page brands it as Data Studio, lists more than 1,400 data sources, and prices the Pro tier at $9 per user per project per month.
Best for: small teams reporting on Google Ads, Google Analytics, Search Console, and Google Sheets.
Watch for: many non-Google sources arrive through community connectors built by third parties, and several popular ones are paid products. Metric definitions are rebuilt report by report, and blending several sources inside one report can get slow and fragile.
Power BI is Microsoft's business intelligence platform. As of October 2026, Power BI Desktop is a free download, Pro costs $14 per user per month, and Premium Per User costs $24 per user per month, both billed annually. Pro allows eight scheduled refreshes per day for a semantic model, while Premium Per User allows 48.
Best for: companies already on Microsoft 365, with an analyst who can model data in Power Query and DAX.
Watch for: the modeling power is real, but it depends on that analyst. Marketing connectors vary in quality, and eight daily refreshes may be too few for teams that adjust spend during the day.
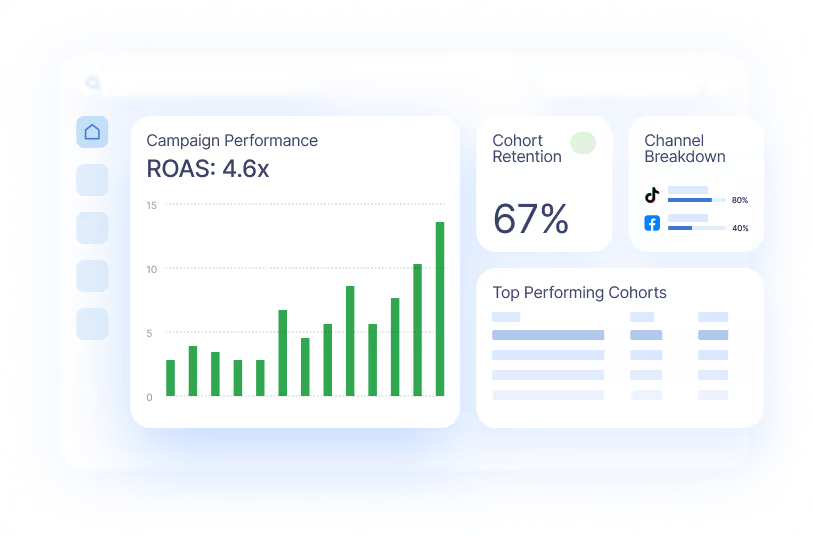
Triple Whale is an ecommerce analytics platform built around Shopify stores. As of October 2026, it offers a free plan and paid tiers priced by a brand's annual GMV, its own attribution pixel (Triple Pixel), an AI assistant called Moby, and data warehouse syncing on higher tiers.
Best for: DTC brands on Shopify that want blended ROAS, attribution, and creative reporting without building anything.
Watch for: attribution comes from the vendor's model, so it is one more view of the truth rather than the record of it. Pricing rises with revenue. Brands that also sell on Amazon, run wholesale, or need B2B pipeline will usually outgrow a Shopify-centric view, and unifying Shopify and Amazon data becomes its own project.
A custom marketing warehouse, typically built on BigQuery or Snowflake, pulls raw data from ad platforms, analytics, ecommerce, CRM, payments, and cost sources into one place on a schedule. Transformations then apply shared business logic: deduplicated orders, returns, COGS, shipping, and fees, so contribution margin and CAC mean the same thing in every report.
Dashboards still sit on top, often in Looker Studio or Power BI. The difference is that the charts read from clean, reconciled tables instead of raw platform exports.
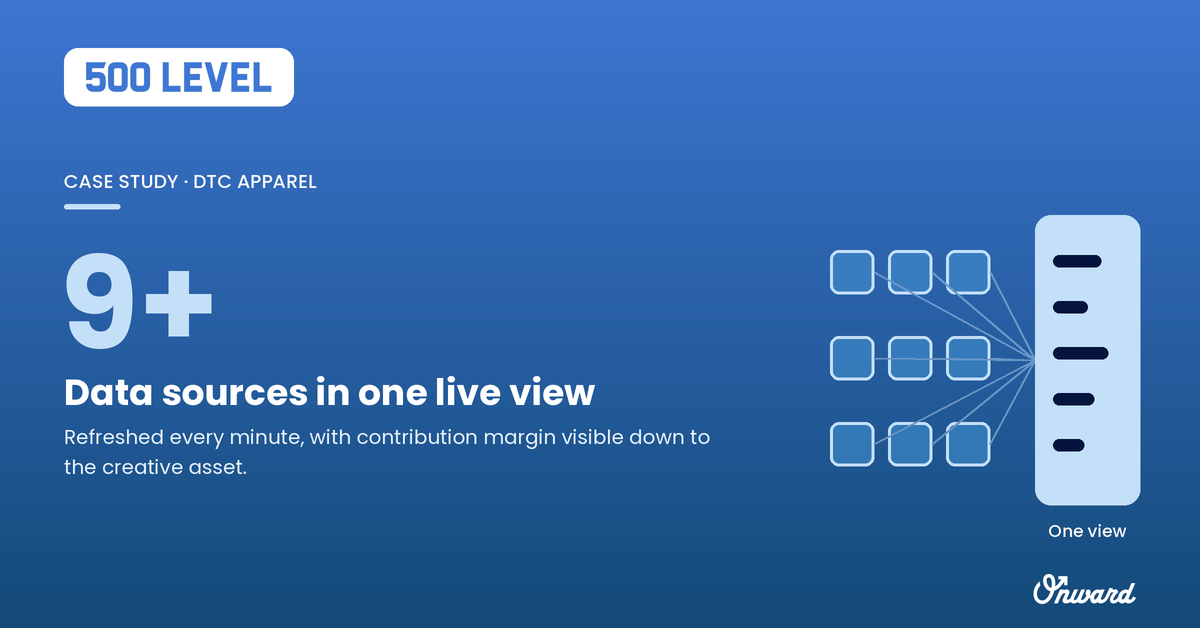
In 500 LEVEL's case, more than nine sources feed a single view, and margin is visible for each individual creative.
Best for: brands with several channels and sales systems, B2B teams tying ads to CRM revenue, and any company where finance needs marketing numbers to reconcile.
Watch for: a warehouse costs engineering time to build and maintain. Without someone owning it, pipelines break quietly and trust erodes.
Choose based on how many sources you have and how close to financial truth your decisions need to be:
Compare total cost, not license cost. A hypothetical example: five Power BI Pro seats cost $70 a month, but if an analyst spends two days every month reconciling platform exports by hand, that labor costs far more than the software. A warehouse shifts that effort from repeated manual fixes to pipelines built once and maintained.
Whatever you choose, test it the same way: pick one month and compare reported revenue against your payment processor. Songfinch is a useful benchmark: after its rebuild, marketing revenue and Stripe payments agree to within one percent, as the Songfinch single source of truth case study shows.

A dashboard earns its cost when it changes a decision, which is the theme of marketing dashboards that drive decisions. Onward builds the warehouse and dashboards for clients and runs media against them, and its FAQ explains how Onward compares to Supermetrics and Funnel.io.
Yes. Both can read from cloud warehouses such as BigQuery. Many teams keep their familiar dashboard tool and change only where the data comes from.
For a Shopify-only brand with simple reporting needs, it can cover a lot. Once CRM, wholesale, marketplace, or detailed cost data matter, most brands need a warehouse they control, which some Triple Whale tiers can sync with.
Pick the dashboard tool for how your team works, and pick the data layer for how accurate your decisions need to be. If you are unsure whether your current numbers would pass a reconciliation test, talk to Onward's team.