© 2025 Onward. All rights reserved.
Designed by BX Studio




Across 2025 the account returned a blended 1.33x ROAS on a product line with a $669 average order value. Seventeen campaigns ran at various points, accumulated across several years and several naming conventions, which left the funnel hard to read from a report and overlapping audiences competing in the same auction.
The tracked conversion rate is the number that matters most. Purchases per link click ran at 0.28% across the year, and read 0.06% by January 2026. For a considered purchase at this price point, that is not a description of a weak funnel. It is an incomplete count. Meta was being sent a fraction of the account's real purchases, and it optimized faithfully toward that fraction.
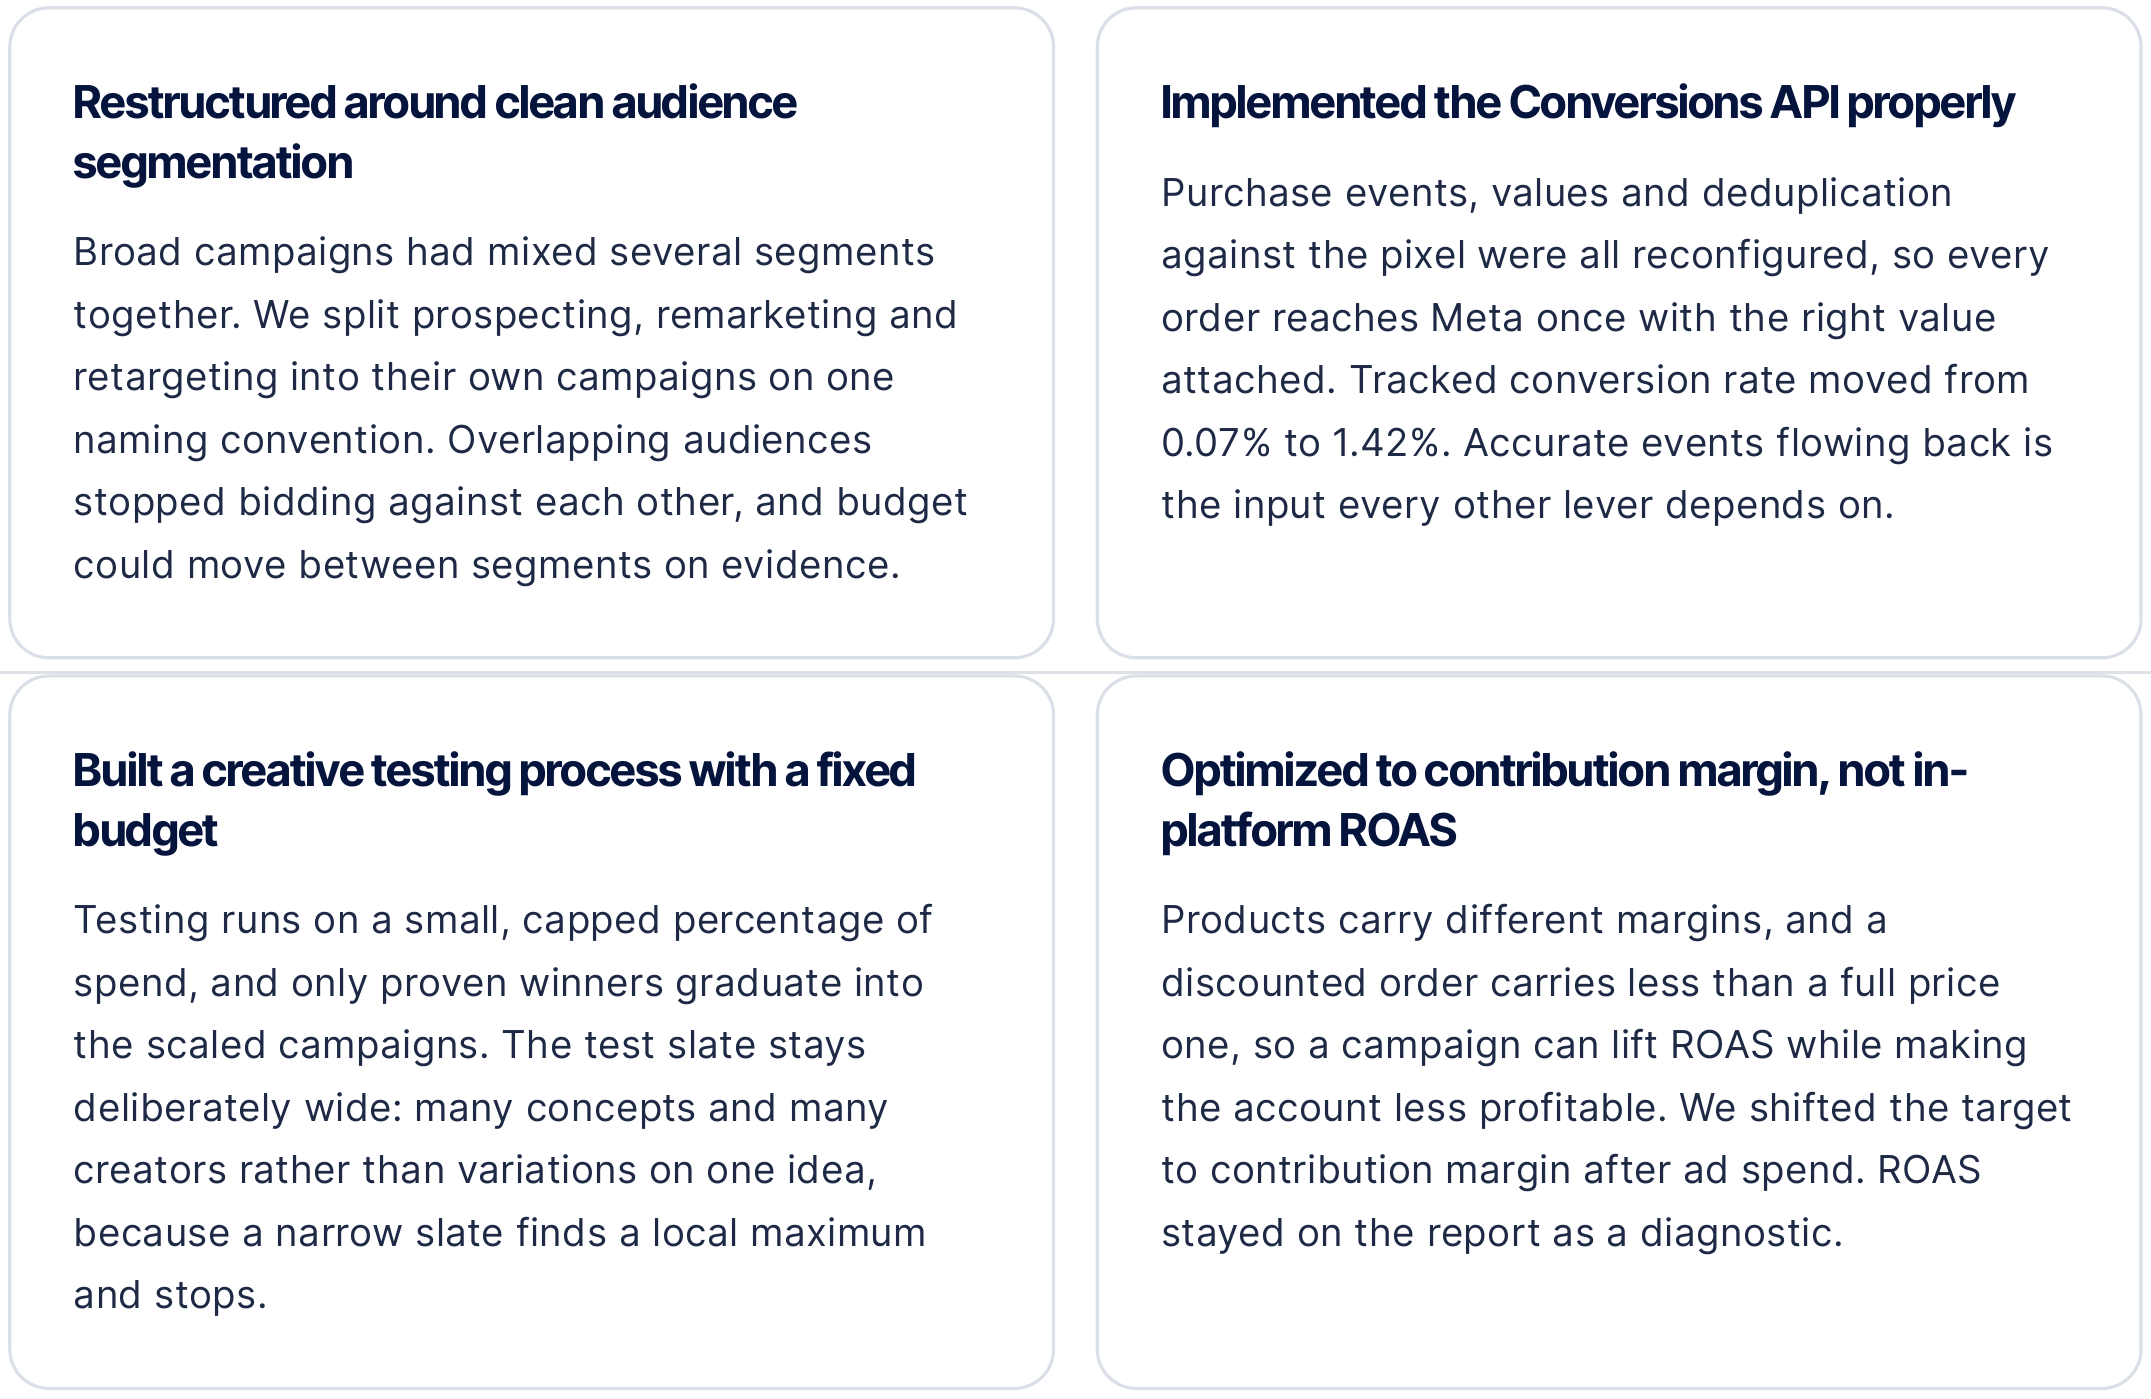
Purchase events, values, and deduplication against the pixel were reconfigured, so every order reaches Meta once with the right value attached. At the same time the account was rebuilt so each audience segment gets its own campaign under a single naming convention. Seventeen campaigns became four, and every ad was tagged across ten fields, so product, creative concept, format, offer and landing page could each be judged separately and budget could move toward what was actually driving revenue at the highest contribution margin.

No single lever did this. Two were structural fixes. Two are ongoing disciplines that compound.


Paddleboards are seasonal, so the comparison is our full tenure against the same seven calendar months a year earlier: February to August 2026 against 2025. Across those months Meta-attributed revenue rose 160% while spend fell 23%, lifting purchase ROAS from 1.41x to 4.75x. New customer acquisition carries 82.6% of budget at a 4.78x ROAS, so the growth is coming from buyers the brand did not already have.
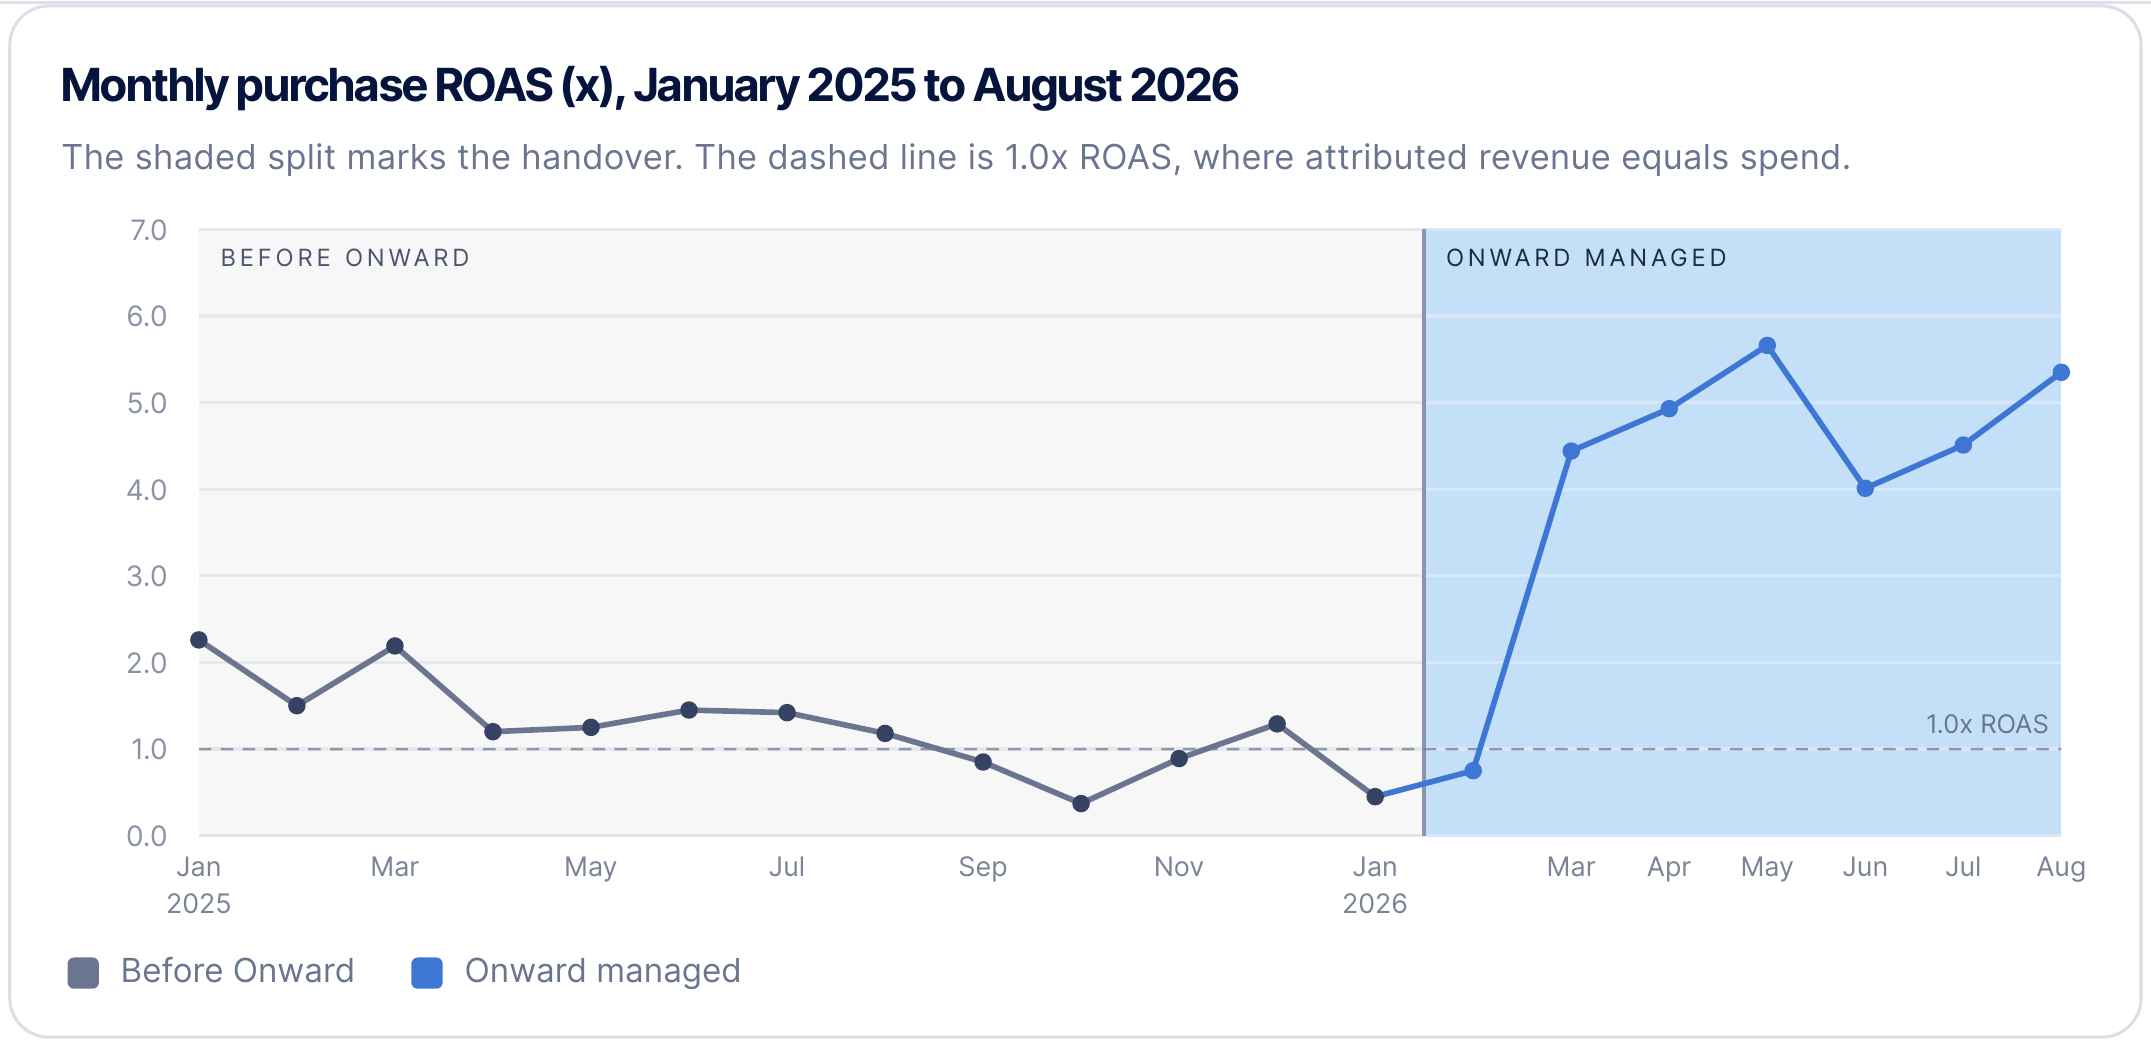
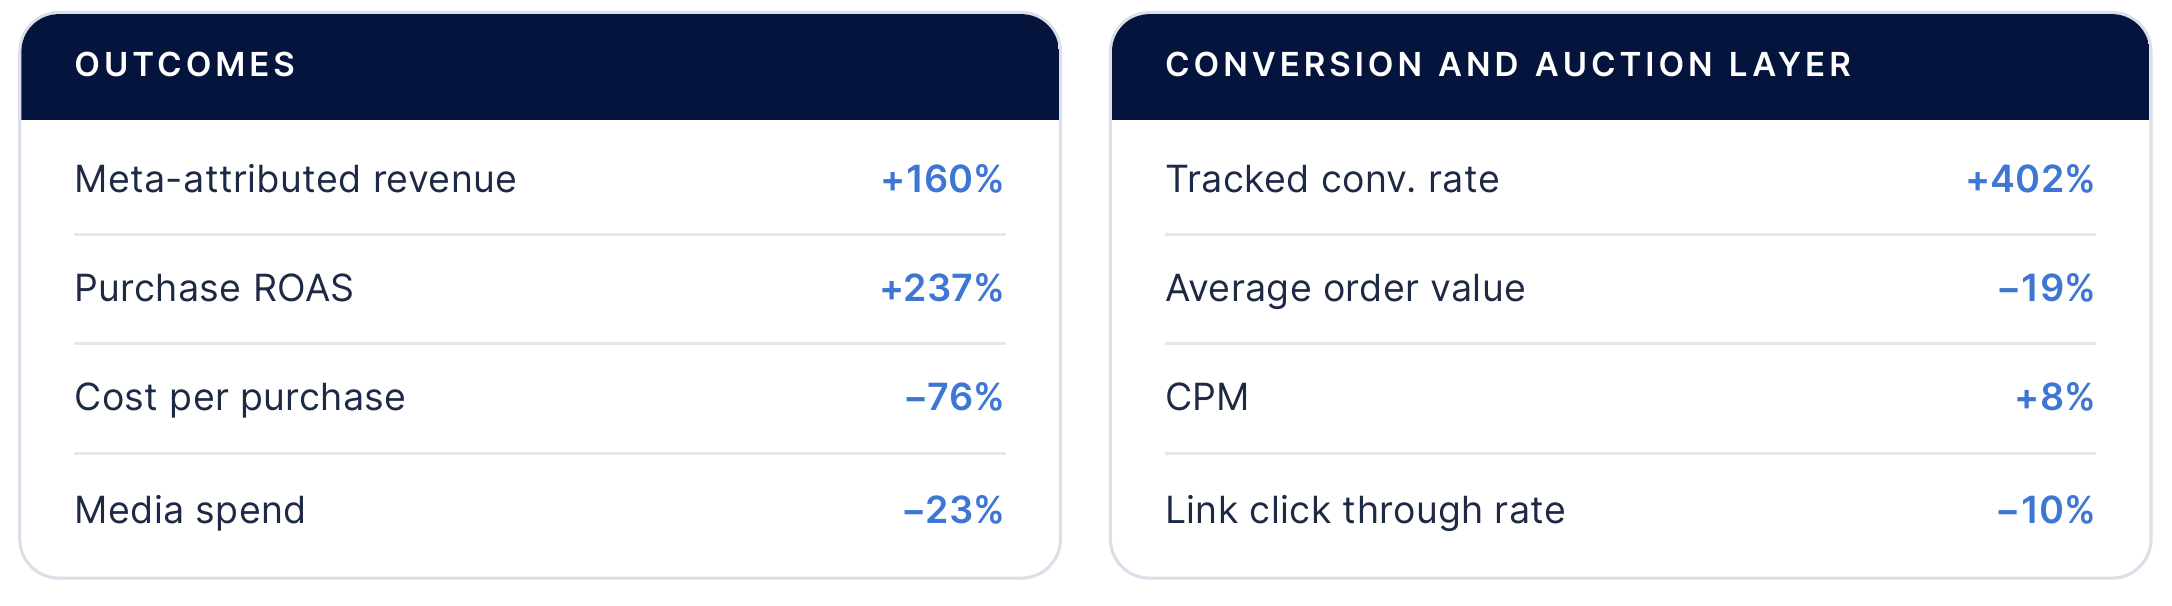
Source data is the ISLE Meta ad account, campaign level, monthly, January 2025 through August 2026. Attribution is 7 day click or 1 day view throughout. All figures are platform reported and have not been reconciled against Shopify. Revenue and conversion gains from March onward include sales the account was making but not recording, so part of the lift is recovered visibility rather than new demand. The HAVN sub brand is excluded from every figure.